1. Istio — Getting started guide
Istio — https://istio.io — is a new Microservice service mesh manager for making microservice deployments less complex and eases the strain on development teams.

Blogposts, Tutorials, Code Samples & Videos. All you need to get started.
Microservice Deployments on Kubernetes
 Istio
Istio
Istio — https://istio.io — is a new Microservice service mesh manager for making microservice deployments less complex and eases the strain on development teams. It is a completely open source service mesh that layers transparently onto existing distributed applications. It is also a platform which included APIs that let it integrate into any logging platform, telemetry or policy system.
A service mesh is a term we use to describe the network of microservices that make up a distributed microservice architecture that makeup applications and the interactions between them.
As these service meshes grow with size and complexity they become harder to understand and manage. It can require discovery, load balancing, failure recovery, metrics, and monitoring. They can also have more complex operational requirements such as A/B testing, canary releases, rate limiting, access control, and end-to-end authentication.
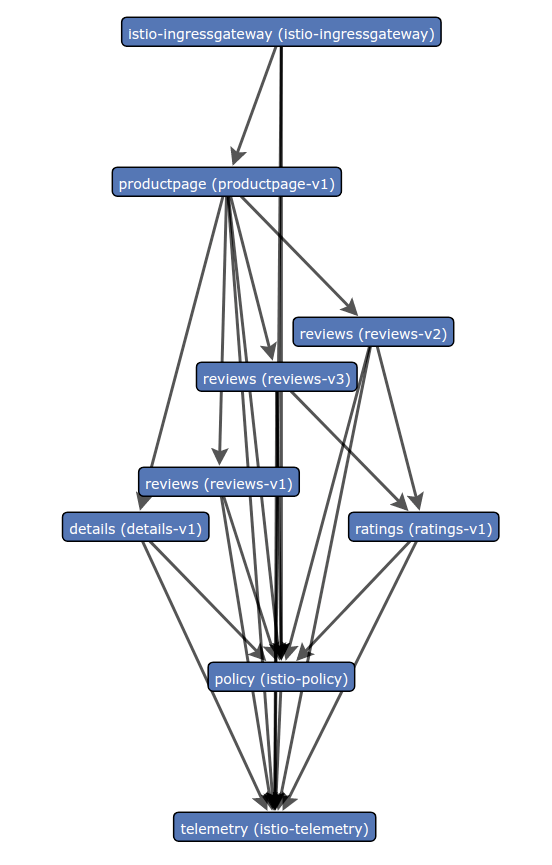 Booking info application service mesh
https://istio.io/docs/tasks/telemetry/servicegraph/
Booking info application service mesh
https://istio.io/docs/tasks/telemetry/servicegraph/
How can we manage this service mesh complexity? In comes Istio which provides behavioral insights and operational control over the service mesh as a whole, offering a complete solution to satisfy the requirements of microservice applications.
Istio makes it easy to create a network of deployed services with load balancing, service-to-service authentication, monitoring, and more, without any changes in service code. To do this you add Istio support to services by deploying a sidecar proxy throughout your environment that intercepts all network communication between microservices. You then configure and manage Istio using its control plane functions, such as:
· Automatic load balancing for HTTP, gRPC, WebSocket, and TCP traffic.
· Fine-grained control of traffic behavior with rich routing rules, retries, failovers, and fault injection.
· A pluggable policy layer and configuration API supporting access controls, rate limits and quotas.
· Automatic metrics, logs, and traces for all traffic within a cluster, including cluster ingress and egress.
· Secure service-to-service communication in a cluster with strong identity-based authentication and authorization.
In this article, I will show the steps for how I got started with Istio on my Kubernetes cluster that I provisioned on Oracle Cloud.
Steps taken:
The conclusion is that leveraging Istio on OKE is quite straightforward.
Install Istio Client in Linux VM
The first step with Istio, prior to deploying Istio to the Kubernetes cluster, is the installation on your client machine of the istioctl client application and associated sources, including the Kubernetes yaml files required for the actual deployment.
Following the instructions in the quick start guide: https://istio.io/docs/setup/kubernetes/quick-start.html
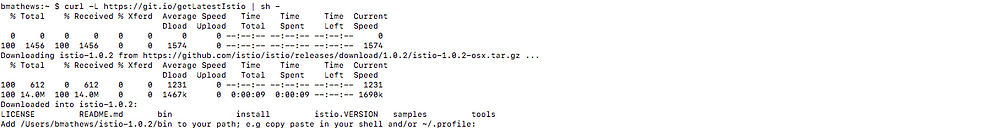
Firstly I downloaded the latest version of Istio to my Mac
curl -L | sh -
 Istio Service Dashboard
Istio release download
Then move to the Istio directory:
cd istio-1.0.2
The installation directory contains:
You then add the istioctl client to my PATH environment variables:
export=$PWD $PATH
Ensure that the current OCI and OKE user is allowed to do cluster administration tasks by creating a Role-Based Access Control policy
kubectl create clusterrolebinding <admin-binding> –clusterrole=cluster-admin –user=<user-OCID>
Note:
Deploy Istio to your Oracle Cloud OKE Kubernetes Cluster
I will cover the installation of Istio using Helm below, however, prior to performing the installation, let’s make some changes to the Istio “values.yaml” file. The “values.yaml” file informs Helm which components to install on the OKE platform. The “values.yaml” file is located at:
In order to have the components Grafana, Prometheus, Servicegraph, and Jaeger deployed, the “values.yaml” file needs to be modified. For each of the components you want to be deployed, change the enabled property from “false” to “true” eg:
Servicegraph:

enabled: true

replicaCount: 1

image: servicegraph

service:

name: http

type: ClusterIP

externalPort: 8088

internalPort: 8088
Once you have made these changes to the “values.yaml” file you can save. and exit and you are now ready to install Istio!
If you are using a version of Helm prior to 2.10.0 then you must first install Istio’s Custom Resource Definitions via the kubectl apply:
kubectl apply -f install/kubernetes/helm/istio/templates/crds.yaml
After this command execution you will have to wait a few seconds for the Custom Resource Definitions (CRDs) to be committed in the kube-apiserver.
Once the CRDs have been added to the kube-apiserver we can now render Istio’s
core components to a Kubernetes manifest called istio.yaml:
helm template install/kubernetes/helm/istio --name istio --namespace istio-system > $HOME/istio.yaml
Now that the components have been rendered manifest file we can now install the components via the manifest by:
Creating the namespace in Kubernetes with Kubectl:
kubectl create namespace istio-system
We then apply the istio.yaml file to install istio:
kubectl apply -f $HOME/istio.yaml
We can now see that Istio has been installed to our pods by running:
kubectl get pods -n istio-system
Since the “values.yaml” was modified to enable the deployment of Grafana, Prometheus, ServiceGraph, and Jeager you will see those components deployed as well.
While Istio states there is automatic sidecar injection; there are some slight limitations to this . Automatic sidecar injection must be specified per namespace; therefore, if you do not enable your namespace for automatic injection then the sidecar will not be injected into your pods. I do not recommend enabling the default namespace for automatic sidecar injection.
Please note, when enabling automatic sidecar injections that there may in future be some components that you deploy to the default namespace and you don’t want the sidecar deployed alongside the component. It would be better to deploy your application to a specified namespace and then set this namespace for automatic injection.
Note:
In order to have sidecar injection at deployment, you must enable the namespace for your application. To enable the namespace for automatic injection execute the following command:
kubectl label namespace default istio-injection=enabled
For this demo, we are going to deploy the Istio provided “bookinfo” sample application. You can find this application in the samples directory from the Istio download, which we downloaded earlier. Keep in mind that we previously enabled automatic sidecar injection during the installation of Istio and also enabled the default namespace for automatic sidecar injection. Therefore, when you deploy the book application an Envoy sidecar proxy is deployed in each pod.
Each of the black boxes in the below diagram are instances of the Envoy proxy sidecar. When the “bookinfo” application is deployed to the Kubernetes cluster Istio deploys the sidecar in the pod alongside of the microservice.
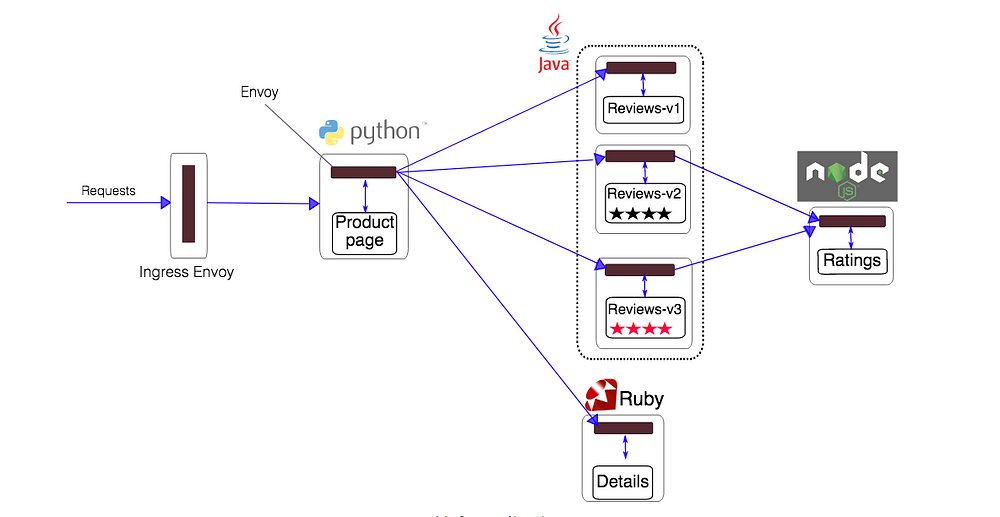 Istio bookinfo architecture
https://istio.io/docs/examples/bookinfo/
Istio bookinfo architecture
https://istio.io/docs/examples/bookinfo/
Note:
This application is polyglot, i.e., the microservices are written in different languages. It’s worth noting that these services have no dependencies on Istio, but make an interesting service mesh example, particularly because of the multitude of services, languages and versions for the
reviewsservice.
Let’s deploy the bookinfo application.
kubectl apply -f /<istio installation directory>/samples/bookinfo/platform/kube/bookinfo.yaml
After the successful deployment, let’s take a look at the pods that were deployed.
We can check our pods by running:
kubectl get pods
We then need to make the application accessible from outside your Kubernetes cluster. To do that, we need to create an Istio gateway:
<istio installation directory>/samples/bookinfo/networking
We can check this gateway by:
kubectl get gateway
We can also check the cluster-ip and ports for this gateway by running:
kubectl get svc -n istio-system
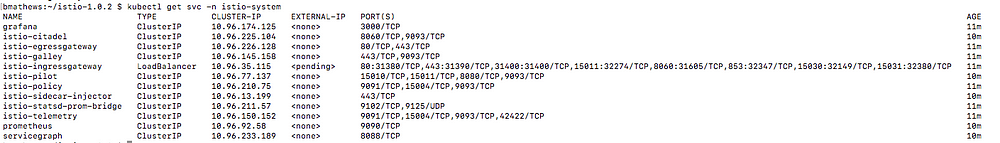 Gateway information output from “kubectl get svc -n istio-system”
Istio is now installed on our cluster with the bookinginfo application, we can now check out some of the monitoring functionality and dashboards available.
When you install Istio, with all of the dashboards enabled, there will be 4 dashboards available, in addition to the standard Kubernetes dashboard. Each dashboard provides their own unique features and will be key for managing and monitoring your Kubernetes cluster. Since each dashboard is a product in its own right I will not cover each product in depth. To understand the key features of the dashboards I recommend that you review each product’s documentation page. There are also several books that have been written on many of these products.
The Grafana add-on is a preconfigured instance of Grafana. The base image has been modified to start with both a Prometheus data source and the Istio Dashboard installed. The base install files for Istio, and Mixer in particular, ship with a default configuration of global metrics. The Istio Dashboard is built to be used in conjunction with the default Istio metrics configuration and a Prometheus backend.
To set up the Istio dashboard we will need to set up a port forward to the dashboard fro kubectl locally on your laptop:
kubectl -n istio-system port-forward $(kubectl -n istio-system get pod -l app=grafana -o jsonpath=’{.items[0].metadata.name}’) 3000:3000 &
Once this has been configured we can access the dashboard at the :
http://localhost:3000/dashboard/db/istio-mesh-dashboard
The Istio service mesh delivers six default Grafana dashboards. Please see some screenshots of these dashboards below:
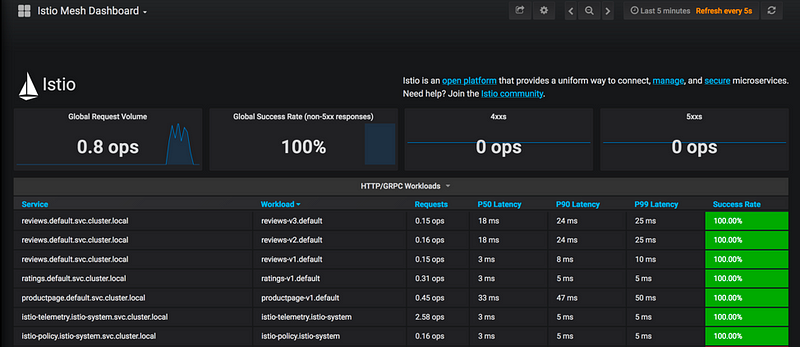
Mesh Dashboard
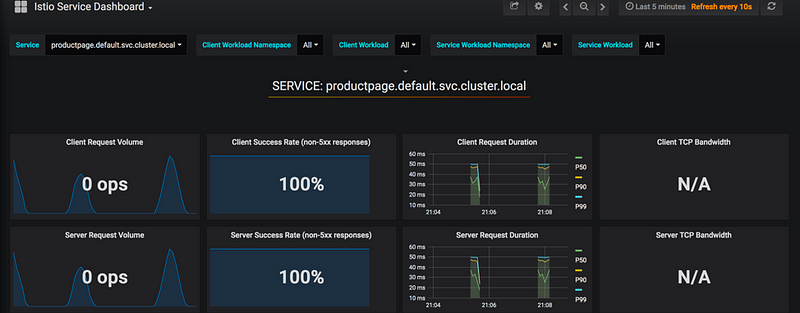
Istio Service Dashboard
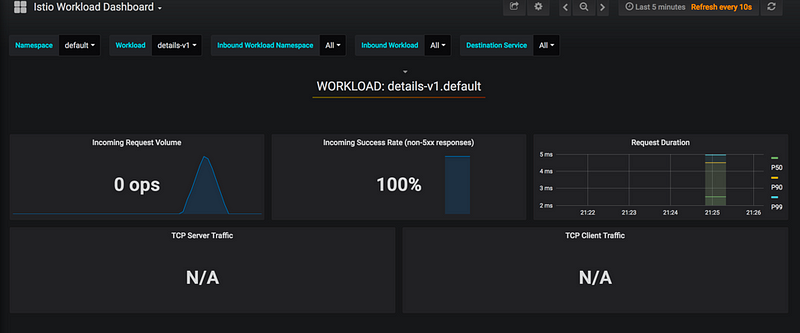
Istio Workload Dashboard
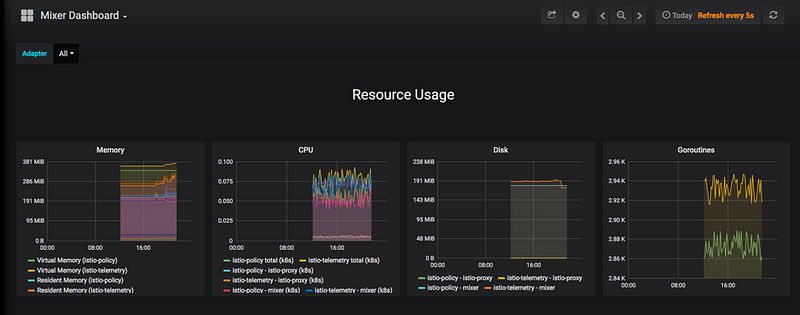
Istio Mixer Dashboard
The Grafana add-on is a pre-configured instance of Grafana. The base image (grafana/grafana:4.1.2) has been modified to start with both a Prometheus data source and the Istio Dashboard installed. The Istio Dashboard is built to be used in conjunction with the default Istio metrics configuration and a Prometheus backend. More details on Prometheus: https://prometheus.io/ .
Why not give this a try for yourself with a free Kubernetes instance hosted on Oracle Cloud with $300 free credit http://bit.ly/brianMediumBlog
Brian Mathews @DevOps4Days
Istio — https://istio.io — is a new Microservice service mesh manager for making microservice deployments less complex and eases the strain on development teams.
How to deploy a simple Kubbernetes cluster with a few clicks through the Oracle Cloud Infrastructure (OCI) Web console.